Installation should be easy. Simply download and run the installer. If you run into any snags, let me know.
Once you have your data in Excel, running a Tulip Cell function on it is easy.

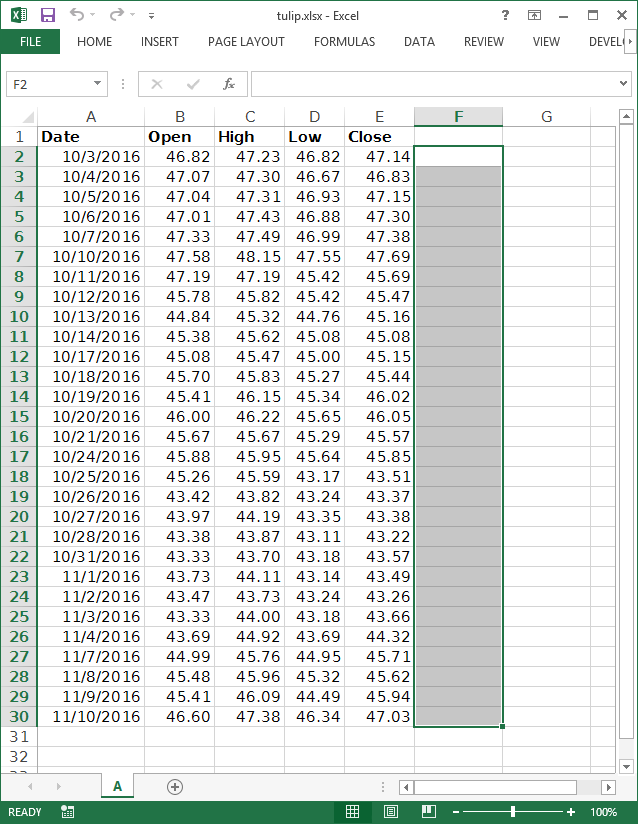
First select the output cells where you want the calculated values to go.
Make sure you allow enough room. If a function returns several outputs (MACD, for example), you'll want to select multiple columns.
In this example, we're going to calculate a exponential moving average, so we only need one column.

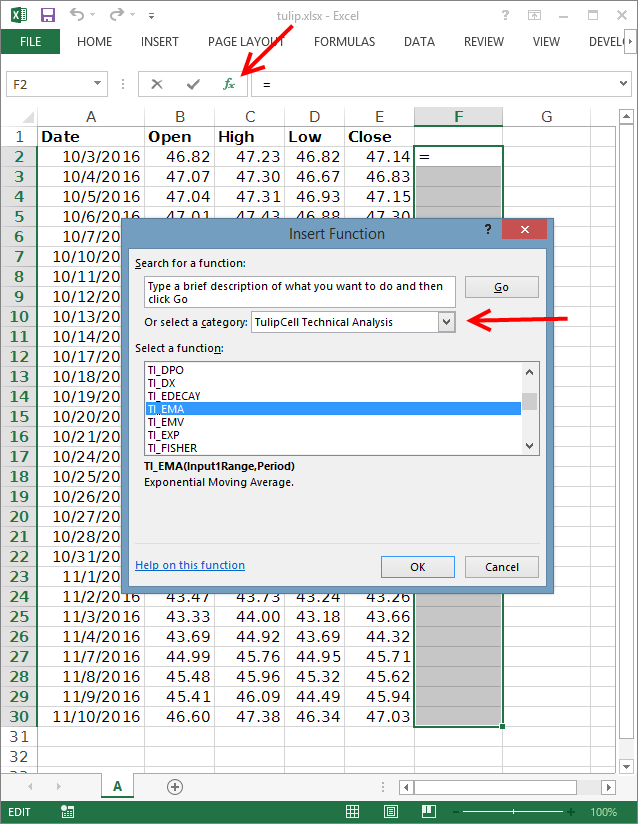
Open the Insert Function window by pressing the little fx button near the formula edit box. [1]
In the Insert Function window, select the Tulip Cell category. [2]
Select the function you want to calculate. Here we've selected the exponential moving average.
Press OK.

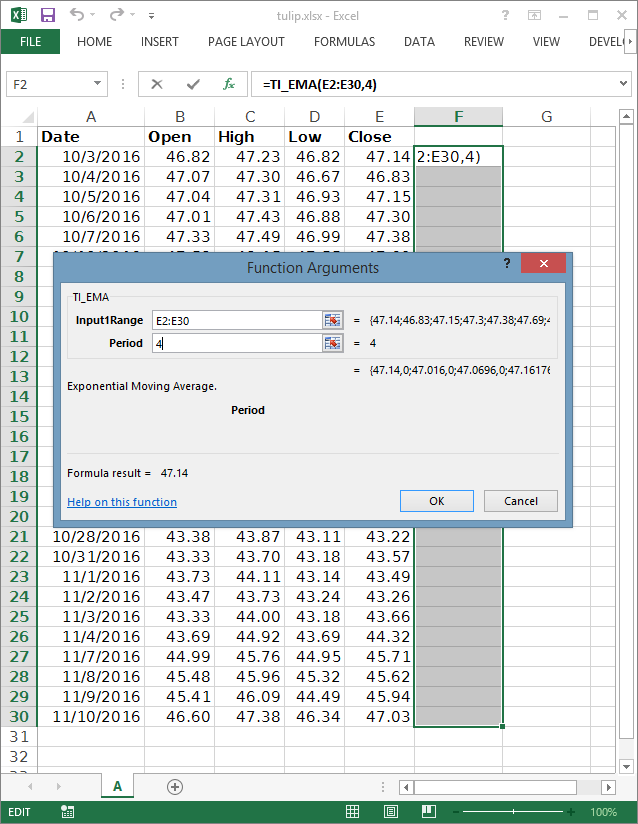
In this dialog, we set the function's inputs and options. Here we've set the input to our moving average as the close column, which is E2:E30. We've set the period option to 4. Different indicators take different numbers of inputs and options.
Press OK when you've finished setting the function arguments.

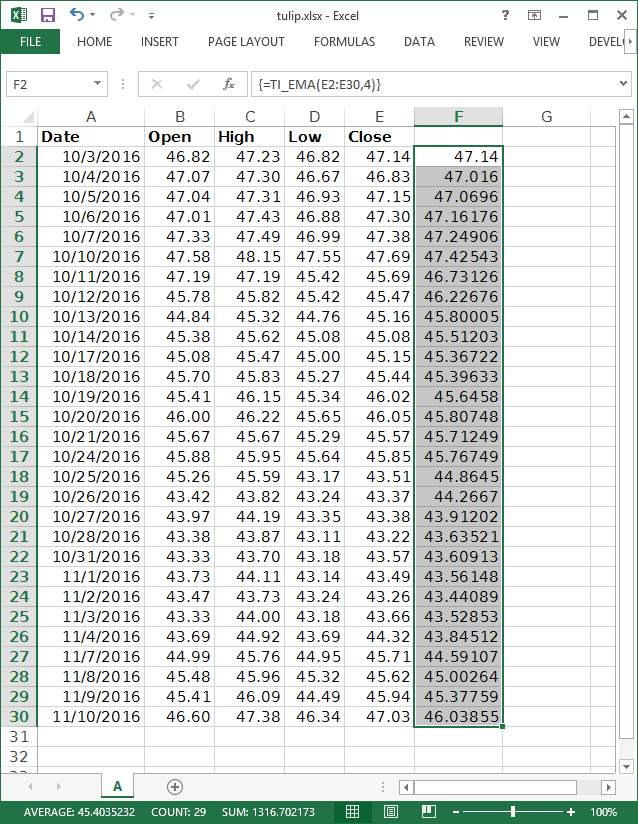
If you haven't used array function in Excel before, this part may be tricky. Make sure the formula edit box is selected, and press Ctrl-Shift-Enter. This tells Excel that you're doing an array function and it'll populate the output cells for you.
Congratulations, you're doing technical analysis in Excel!
If you've run into any snags, let me know.